ENPH 479 — Engineering Physics Project II, running September 2026 – April 2027. This page describes the system we’re building — it’s a snapshot of an in-progress capstone, not a finished result, and I’ll update it as milestones land.
Coding agents are increasingly judged by benchmark score alone, but almost nobody reports what it costs to get that score — tokens burned per task actually solved, wall-clock time per solved task, or how success rate trades off against token budget. Our team is building a terminal coding agent harness from first principles, with no existing agent framework underneath it, and evaluating it against both a benchmark reference scaffold and an established external harness on Terminal-Bench 2.x — a public suite of containerized command-line tasks graded by task-owned test scripts rather than by us. Every harness runs against the same self-hosted open-weight model under one controlled protocol, so a win can only come from the harness itself.
My role on the team is the inference serving and harness layers: the self-hosted vLLM/SGLang stack the agent talks to, and the execution loop, context manager, and tool layer that make up the harness itself.
Skills developed
Focused on the harness and inference side:
- Supervisory control loops around a nondeterministic component (retry, halt, and recovery logic)
- Self-hosted LLM inference serving — vLLM/SGLang, KV-cache/prefix-cache tuning, GPU memory budgeting
- Batching and throughput optimization under concurrent, high-volume rollouts
- Context/state management under a fixed token budget
- Sandboxed tool execution and fault isolation (Docker, no network egress)
- Paired experiment design and noise-floor measurement
System design
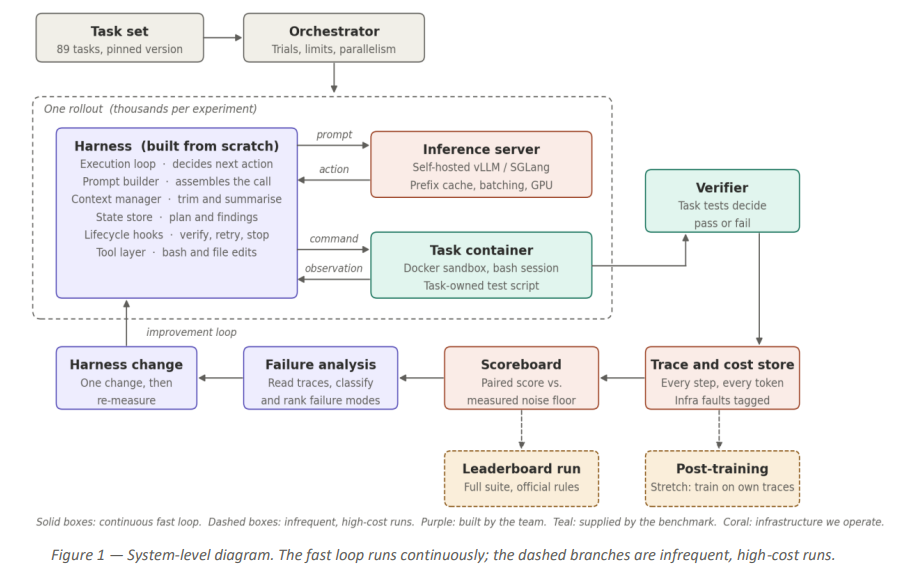
The fast loop (solid boxes) runs continuously — orchestrator, harness, inference server, task container. The dashed branches (scoreboard, failure analysis, leaderboard runs, post-training) are infrequent, high-cost passes that close the improvement loop.
Only one layer of that diagram is ours to write: the harness. The task containers and their verifiers are supplied untouched by the benchmark, and the inference server is infrastructure we operate but don’t modify the internals of. Everything else on the diagram exists to run that loop at scale and turn its output into the next design change.
Task set & orchestrator
Terminal-Bench 2.x supplies 89 containerized tasks at a pinned version — each one an instruction, a workspace, and a task-owned test script. The orchestrator launches rollouts against this set in parallel, under a fixed trial count per task and pinned per-rollout resource limits (CPU, memory, process count, timeout), and stamps every rollout with the exact model revision and harness configuration it ran under so results stay traceable back to a specific build.
The harness
This is the layer I’m building, and the one every other box in the diagram exists to support. One turn moves through six stages:
- Context manager & state store — decide what the model sees this turn: the running plan, prior findings, and however much of the trimmed conversation history survives the token budget.
- Prompt builder — assembles that state into the actual request sent to the inference server.
- Inference server — returns a proposed action (a shell command, a file edit, a “done” signal).
- Lifecycle hooks — check whether that action is permitted and whether the run should terminate, before anything executes.
- Tool layer — executes the approved action against the task container’s bash session or file system.
- Context manager (again) — the resulting observation is retained, summarized, or discarded before the next turn starts.
Every one of those six stages is a variable we can independently swap and measure — which is the point of building it ourselves instead of adopting an existing framework.
Inference server
A self-hosted open-weight model served on vLLM or SGLang — the other layer I own, and the one that decides how fast the rest of the project can move.
Why it isn’t just an API call. An agent loop resubmits its entire accumulated conversation on every turn — every prior tool call, every file it read, every command it ran. That means prefill cost, not decode cost, dominates: one published measurement put agentic workloads at roughly 97% input tokens. Treating the model as a black-box endpoint throws away the one lever that actually controls cost and speed at this scale, which is why the serving stack is something we stand up and tune ourselves rather than rent.
KV-cache and prefix caching. A transformer generates a request in two phases — prefill (the whole prompt processed in parallel to populate the key-value cache) and decode (output tokens generated one at a time). Because each turn’s prompt is the previous turn’s prompt plus one new tool result appended to the end, almost the entire prefill is identical to work already done last turn. A serving stack that retains the KV cache across turns turns that repeated prefill into a cache lookup instead of a full recomputation — the difference between a turn costing O(1) new work and O(n) new work. Cache hit rate, not model quality, is the number I’m actually optimizing for.
Batching under concurrent rollouts. The project runs thousands of rollouts per experiment, many in flight at once, each at a different point in its own multi-turn trajectory. Continuous batching (as opposed to static, fixed-batch scheduling) lets the server admit and evict individual sequences from a batch every decode step rather than waiting for a whole batch to finish together, and paged KV-cache memory management (PagedAttention-style block allocation) is what makes it possible to hold hundreds of concurrent partial conversations in GPU memory without fragmenting it into unusable slivers. Getting the batching and memory config wrong shows up as the same symptom either way: falling GPU utilization and rollouts/hour as concurrency increases, instead of holding roughly flat.
Where harness and inference actually meet. Cache hit rate isn’t purely an inference-server setting — it’s also a property of how the harness constructs its prompts. If the context manager rewrites or reorders the stable prefix of the conversation instead of only ever appending to it, every cache entry for that sequence is invalidated and the server is forced back to full recomputation. One published comparison found that routing the same open model through a mismatched harness collapsed cache hit rate and inflated cost far above the same model on a leaner scaffold — the harness and the server have to be designed against each other, not separately.
Two-track operation. A single-GPU open-weight model scores near the floor on the hardest tasks in the suite, where harness effects on success rate become too small to see. So iteration runs on two tracks: a development track on this self-hosted stack, running a task subset chosen to sit in a mid-range pass band, generating thousands of near-free rollouts for fast design iteration; and a headline track on a full frontier hosted model against the complete official suite, run rarely, for milestone reporting and any eventual leaderboard submission.
What gets instrumented. Every rollout is decomposed into prefill time, decode time, tool-execution time, and harness/orchestration overhead, alongside prefix-cache hit rate and sustained rollouts-per-hour — so a slowdown or a cost regression can be traced to a specific stage instead of showing up only as a worse aggregate number.
Task container & verifier
Supplied by the benchmark and deliberately untouched by us. Each task is a Docker sandbox with a bash session and a task-owned test script; our harness gets a shell and nothing else, and the test script alone decides pass or fail — we never grade our own work.
Trace and cost store, scoreboard, failure analysis
Every step, every token, and every infrastructure fault is logged per rollout. The scoreboard runs a paired comparison against a measured noise floor, and only a difference that survives that comparison counts as an improvement. Failure analysis reads the surviving traces, classifies and ranks failure modes, and turns that into exactly one harness change to test next — the weekly loop that drives the whole project.
Leaderboard run & post-training
The dashed, infrequent branches: a full-suite run under the benchmark’s official rules for public leaderboard submission, and a stretch goal of post-training an open-weight model on trajectories collected from our own harness runs.